wide complex tachycardia
First Glance:
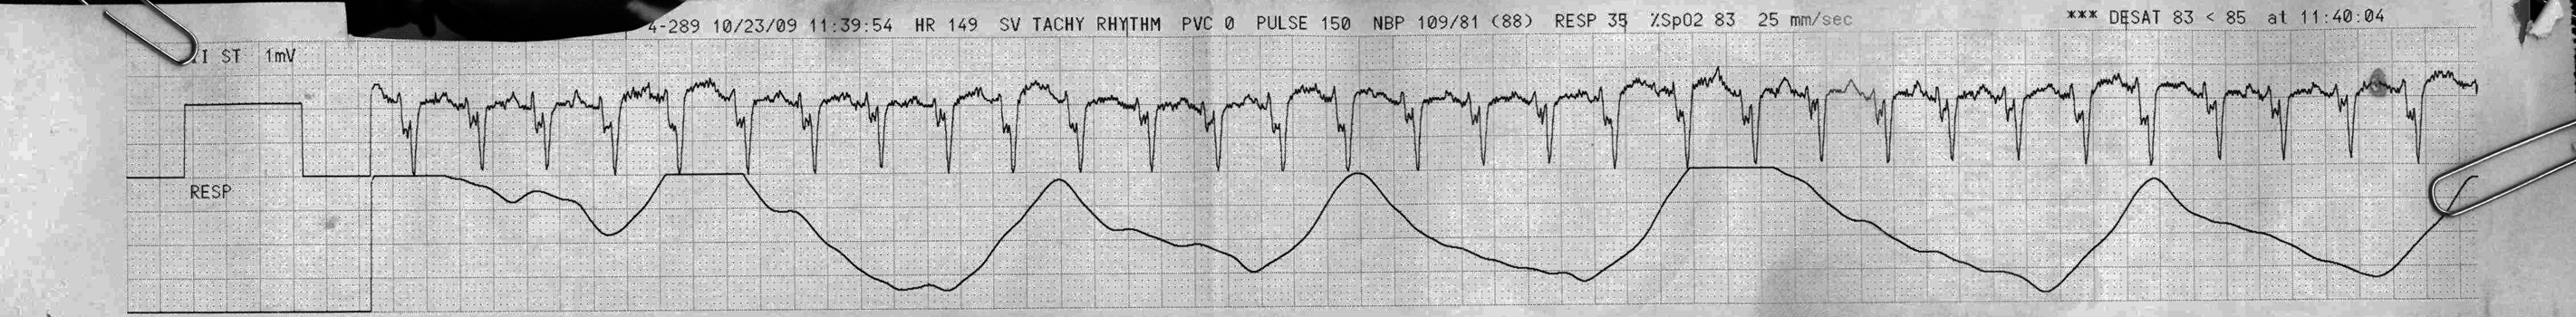
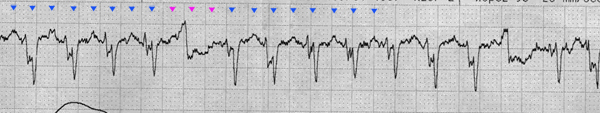
From across the room it looks like a regular wide complex tachycardia at ~150bpm.
Discussion:
The first thing that springs to mind is whether this is VT. Sure- 150bpm is a fair rate for VT, and we do have regular but unusual-appearing QRS complexes (more like rsr’S’ complexes) that are over 120ms, and we do have an unusual axis for what the machine claims is lead II. However- it doesn’t feel obvious. I see regular positive deflections before the large S waves that look like atrial depolarizations with a PR interval of ~110-120 ms. These are most apparent in the first few beats of the strip, and the last 11 beats.
You could argue that those positive deflections are not atrial waves, but actually part of the T wave. I can not definitively say that is not the case from this strip, but it seemed unlikely due to the morphology. If those were T waves, then it is possible that the unusual morphology of the QRS is actually due to retrograde P waves superimposed on the start of the QRS as would be seen in a junctional tachycardia. Again- can’t rule it out.
Further circumstantial evidence that those positive deflections are atrial waves are that the atrial axis is appropriate for lead II.
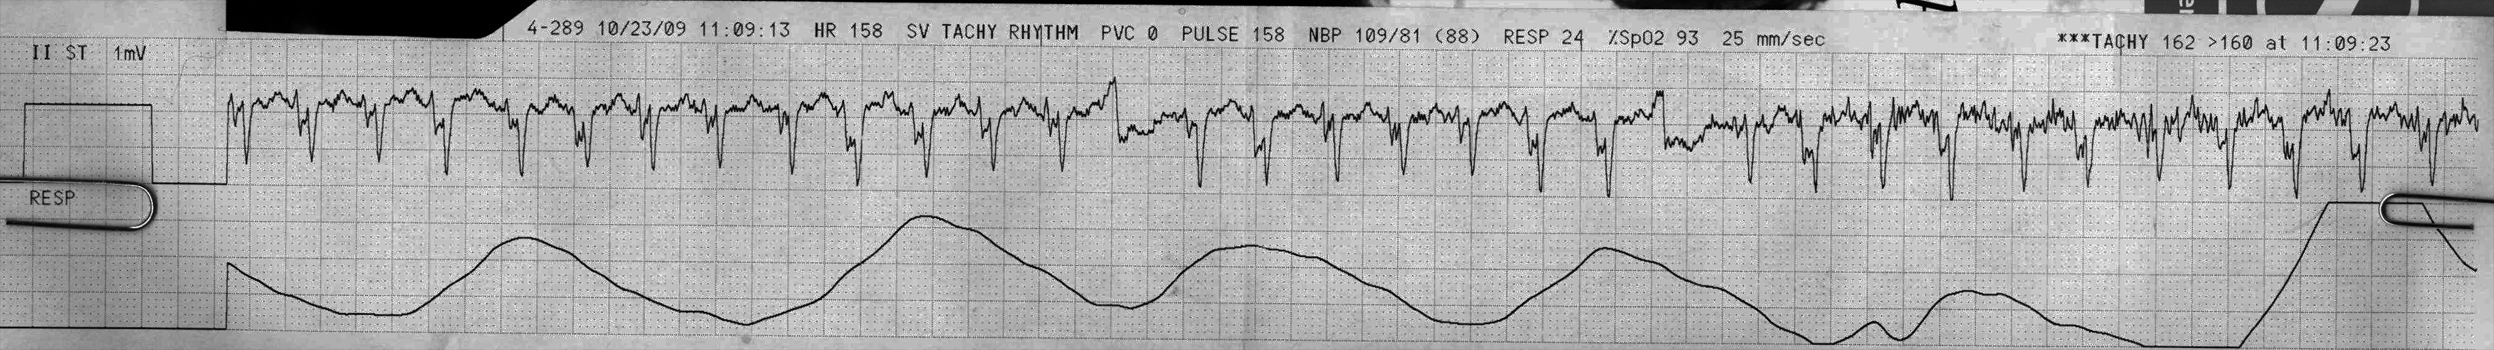
Look at another strip from the same patient, and see if it changes your mind:
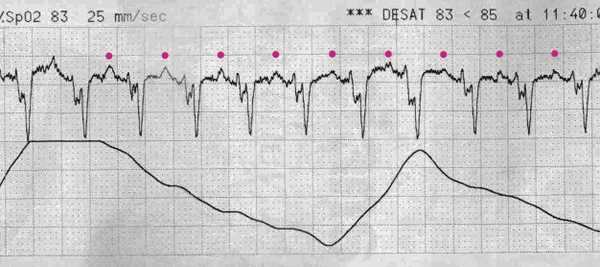
Here we can see the same strip, but with two identical beats that look like PVCs. Now I am less confident still that this is not VT. Look at the supposed P waves tracking through in magenta. Let us call these the ‘X’ waves for now. There is a normal X wave before every QRS, but you could also say there is a normal X wave after every QRS. That’s no help.
But with this new strip we can now see that these alternative beats have broken up the rhythm. Just before the wide ?ectopic beat there is a normal-appearing X wave. If this was sinus tach and the X waves were P waves, then this would make sense. The atria are just humming along like normal, and a PVC just fired in early.
However, when we look after the ectopic beat, we do not see a normal X wave before the next QRS (we would expect a positive ‘X’ spike where the orange triangles are if these are P waves).
Does this mean the X waves are T waves? This would push us more towards junctional tachycardia with aberrancy, or VT.
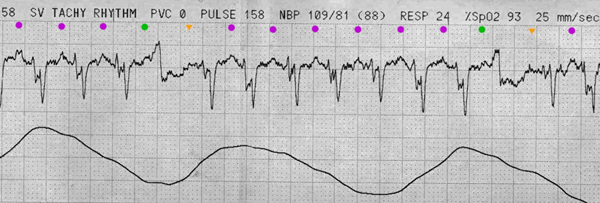
Or wait, if you consider that this is a tachycardia at 150 bpm, should we be considering that constant imitator of all arrhythmias: atrial flutter? what if the X waves are flutter waves, and the unusual morphology seen in the QRS complex is actually due to a 2:1 flutter wave/QRS superimposition? If we track out the X waves as if this was flutter we see this:
While it is impossible to be definitive with this strip, I can convince myself that the slightly-higher-than-300 bpm X waves continue through the ectopic beat and continue with no pause in the underlying X rhythm. It’s a possibility, then. So much uncertainty!!
Final Impression?
Regular wide-complex rhythm at 150 bpm with a couple monomorphic likely ventricular beats.
Management implications:
Compare to prior EKGs to see old morphology. Check lead placement. Attention to a really pristine 12L with a clean baseline would probably crack this case. Adenosine might reveal the underlying atrial rhythm, and synced shocks would be indicated if this was a new rhythm in a hemodynamically unstable patient.
The Take-home Point:
Often you can not make a firm rhythm interpretation on 15 seconds of tele monitoring. Surprise!
![]() Three star strip. Devious stuff.
Three star strip. Devious stuff.