SVT with monomorphic PVCs

First Glance:
Regular narrow-complex tachycardia with a couple PVCs.
Discussion:
Start off looking at the baseline. See anything organized? Me neither. But just because we can’t see P waves doesn’t mean they aren’t there. The motion artifact obscures any fine P waves, and increasing the gain probably wouldn’t change much, especially since we consider it has been jacked up to 2x already.
The QRS complexes do track very regularly across the strip, but the most remarkable thing about them is how small they are. Remember this is already magnified in the vertical axis 2x. This is quite suspicious for one of the various causes of reduced amplitude deflections including including insulation of the heart from the chest (COPD, morbid obesity, pericardial effusion), infiltrative processes (amyloid, etc), and possibly massive reduction in working myocardium as would be seen in a very diseased heart with past or present infarction. This strip shows QRS complexes with an absolute value of vertical deflection of 2mm (at standard 10mm/mV calibration) which is easily consistent with low voltage. The PVCs appear to have a little more kick to them, but I would guess that their deflections are not used in determining whether a lead meets criteria for low voltage.
Check out the lower trace.
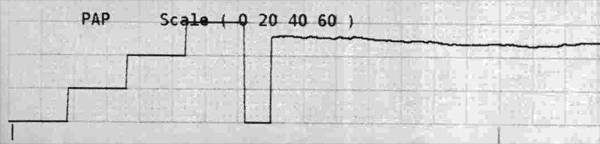
Looks like this patient’s pulmonary artery pressure is hovering around 50. However it isn’t pulsatile so I really can’t say what this is measuring. A high PAP with the low amplitude complexes might suggest COPD, or maybe an infiltrative disease that is affecting both the heart and the lungs simultaneously. However, a non-pulsatile waveform might be a measurement from the RA or the wedge pressure (although honestly I would still expect it to be more pulsatile than this)- either of which should be lower than 50, but each of which would have completely different interpretations. High RA pressure = high CVP = suggestive of R heart failure. High wedge is suggestive of L heart failure. You could check where the cath is (and whether it is zeroed correctly) and adjust your clinical interpretation accordingly.
Given that we can not see atrial waves, this could technically be any regular SVT (sinus, junctional, ectopic atrial, flutter, etc) and will need to be evaluated further.
Final Impression?
Regular supraventricular tachycardia @ ~125 bpm with monomorphic PVCs, suspicious for low voltage.
Management implications:
Get a 12L to evaluate for low voltage and define the rhythm, possibly with increased gain. To reduce the artifact in the search for fine atrial waves the electrodes can be moved more centrally, the patient can be covered with warm blankets to reduce fine shiver, and you can pick a time when the patient is relaxed, not talking, etc.
PVCs are soft markers for diseased hearts prone to fatal dysrhythmias, and 2 PVCs in a 15 second strip is a significant amount worthy of some thought.
It isn’t clear what the swan is reading or whether it is calibrated correctly, so suss that out too.
The Take-home Point:
Low voltage strips can be caused by a number of interesting diseases, but a single low-voltage lead does not mean the rest are. All the limb leads would individually need to have an absolute value of less than 5mm, and the chest leads would individually have to have an absolute value less than 10mm. A 12L will be necessary to evaluate this tachycardia further.
![]() Two star strip. The meat and potatoes.
Two star strip. The meat and potatoes.