sinus with premature supraventricular beat
First Glance:
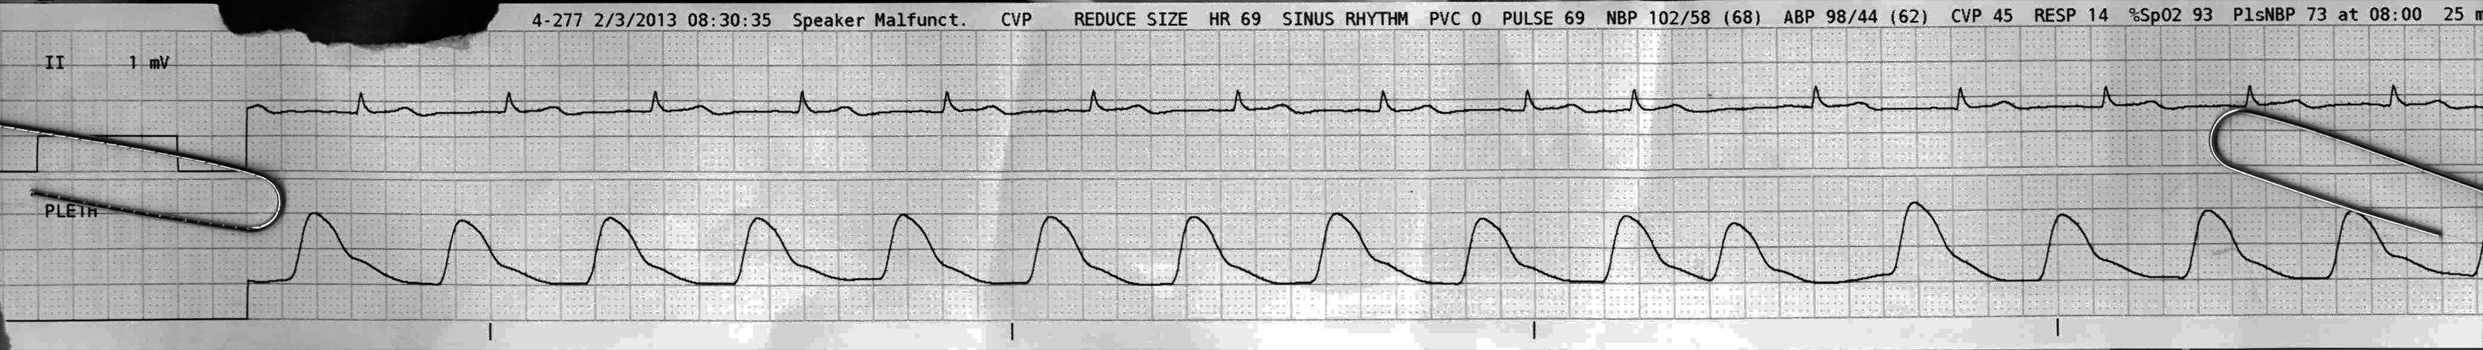
From across the room it looks like a regular narrow rhythm with a premature beat.
Discussion:
First off, how do you know this is sinus rhythm? There aren’t obvious P waves. However, we can see its a very regular narrow rhythm, so this is either sinus, atrial, or junctional. If I even find a few subtle P waves that look the same, have appropriate morphology (ie: upright in II), and have the same PR interval in this setting that is sufficient for me to call sinus rhythm.
So look here:
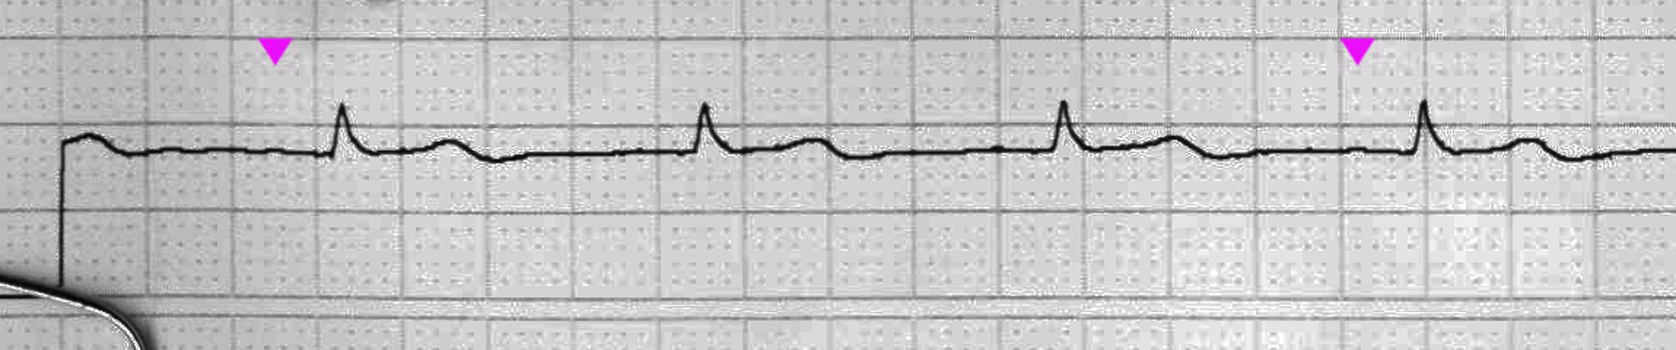
So what we see (despite the poor scan) is that beat 1 and 4 have identical subtle P waves that are positive and have an appropriate PR interval. You might see a little something in the same spot before other beats. Suffice to say, the baseline is so clean here and I’m calling it good. If this mattered clinically to you you would jack up the gain, as this is only at 50% and a gain of 200% would probably show them clearly.
Another clue that this is sinus is that the machine says it is sinus (read the top of the strip). The machine is not always right about this. Really it isn’t. But in a strip like this with such a clean baseline it is probably right. The machine is not looking at the strip visually, but electrically, and it doesn’t need to increase the gain to realize there are little positive deflections before each QRS.
So what of the premature beat? Here we have the same problem. No visible preceding P. So we can’t really say whether this is atrial or junctional. Interestingly, the next sinus beat is exactly on time, which suggests the sinus node was not reset by the premature beat. This makes me wonder whether it was more likely a junctional beat which is slightly less likely to depolarize the atria/sinus node.
How about the Sp02 trace below? We can see that it’s rock solid across the early rhythm, then the PJC has a little less amplitude, and the next sinus beat (after the long pause and subsequent higher preload) has a higher amplitude. It actually looks just like the A-line would have.
In that sense, sometimes I think of the Sp02 waveform as the poor man’s arterial waveform. After all, it is a visual measurement of pulsatile flow (ie: arterial), and in the short term it shows changes that reflect the arterial pressure. A heartbeat with poor cardiac output right next to a heartbeat with normal cardiac output will show a small pulse then a larger pulse.
However, it is a poor poor man’s arterial trace, because the Sp02 trace is qualitative, not quantitative. And the monitor, in order to provide as lovely-looking a trace as possible is always adjusting its own gain. It lags a bit, so you can generally compare beat to beat changes like we see here, but you can’t compare Sp02 waveforms that are a few seconds away from each other as the machine may or may not have made some gain adjustments in that interval.
Final Impression?
Sinus rhythm @ 70 bpm with a compensatory PJC
Management implications:
Nothing. This looks good.
The Take-home Point:
The Sp02 waveform mirrors the arterial waveform, but is more damped from running through a lot of vasculature to reach the microscopic arterioles (ie: you don’t see a marked dicrotic notch, etc), and is constantly gain-adjusted by the monitor to get a good visual trace.
![]() One star strip. Students should identify the rhythm correctly.
One star strip. Students should identify the rhythm correctly.