sinus rhythm with T wave inversion
First Glance:
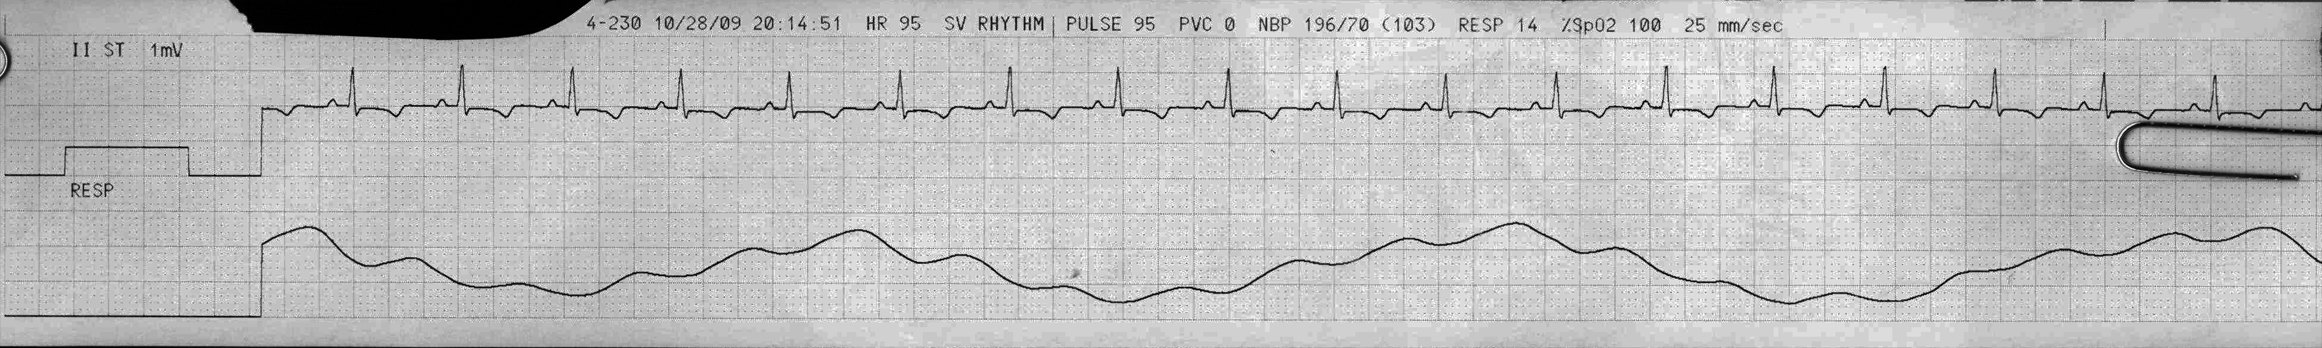
From across the room it looks like sinus rhythm with inverted T waves.
Discussion:
That’s almost all there is to this one, really. The rate is on the high side. The T is inverted, with about a half millimeter of ST depression (at a gain of 40%) which could be suggestive of inferior ischemia, or reciprocal changes from another region. Otherwise the lead II morphology is normal.
Note the lower trace is the respiratory activity. In the standard bedside monitor this is extrapolated from EKG lead data based on chest wall resistance and changes in the EKG axis. Here we see pulsatile variations in the respiratory cycle which are artifacts of that extrapolation.
Sometimes the respiratory trace is not picking up, but you really want to be able to visually see the respiratory activity (and get therefore get a reliable rate). To improve your respiratory trace, you can try respositioning leads more centrally where there is more chest/abd excursion.
Final Impression?
Sinus rhythm @ just under 100 bpm, with suspicion for ischemia.
Management implications:
12L to evaluate for ischemia. If the respiratory artifact becomes more marked than this the monitor may start to think the patient is breathing at the rate of the heart rate, in which case moving the leads more distally (where there is less respiratory movement) may fix this while still allowing a perfect electrical trace.
The Take-home Point:
The respiratory trace on a bedside monitor is calculated from electrical activity, and is subject to artifact, false positives, and false negatives like anything else.
![]() One star strip. Students should identify the rhythm correctly.
One star strip. Students should identify the rhythm correctly.